

Prove GEO ROI by measuring it in three layers — visibility, engagement, revenue — and by showing your boss where each layer sits on a delayed timeline rather than promising all three at once. Visibility shifts show up in weeks 1–4, branded search and direct traffic follow in weeks 4–8, and pipeline influence appears in months 3–6 (HubSpot). The credibility of the whole case rests on one thing you do before any optimisation work: recording a measured baseline across the AI engines your buyers actually use.
Key takeaways
- A citation count on its own is a vanity metric. Tie it to engagement and revenue or expect the budget conversation to stall.
- Baseline first. AI answers vary across runs, prompts and time, so a single measurement is unreliable — visibility should be characterised as a distribution from repeated sampling (Schulte et al., arXiv).
- Attribution will be incomplete. AI engines rarely share referral data, so budget for a branded-search-lift proxy and a CRM self-reported field (HubSpot).
- The infrastructure now exists: Search Console has dedicated generative AI performance reports (Google), and Google Analytics groups ChatGPT (OpenAI) and Perplexity traffic natively (Google Help).
- A pilot scoped to 20–40 high-intent prompts is a workable size, not a sourced benchmark — the real constraint is repeat sampling per prompt, not prompt volume (Schulte et al., arXiv).
- Vendor-reported case data exists — Track360's own blog reports lifting Claude citation rate from a 60% baseline to 78% across 500+ posts in 90 days (Track360) — but no independent sector benchmark exists yet, so set targets against your own baseline.
Before you start: what you need in place
You cannot retrofit a baseline. Assemble these five things before the first optimisation ticket is written:
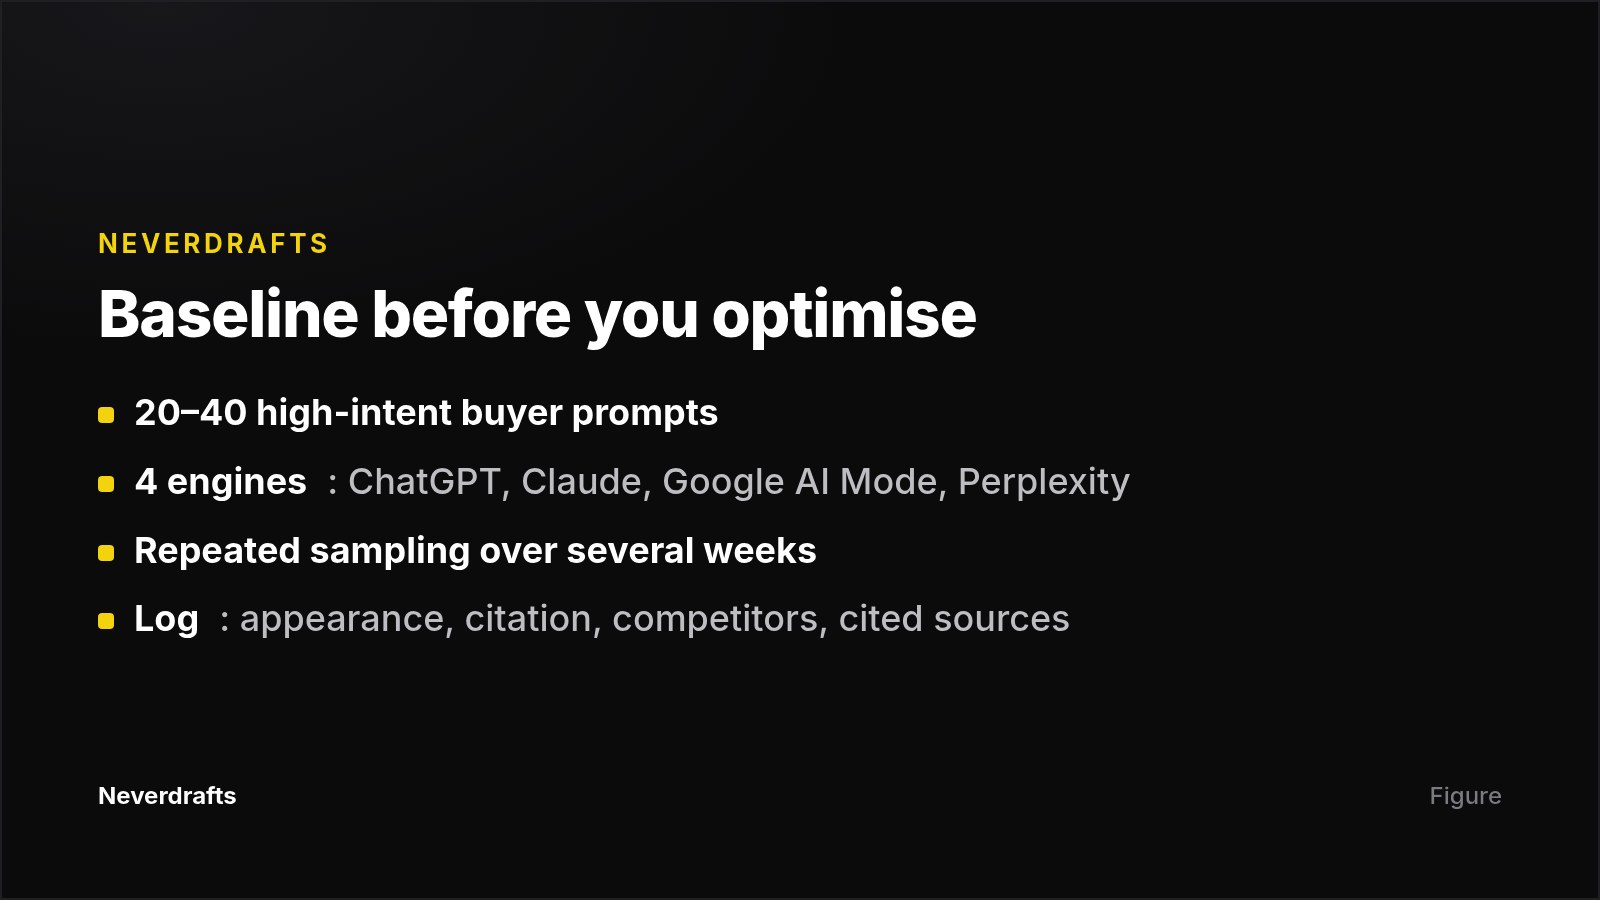
- A prompt set of high-intent buyer questions. Questions a prospect would actually type before a purchase, not brand-name lookups. Twenty to forty is a workable scope for a first pilot.
- Access to the engines your buyers use. At minimum ChatGPT, Google AI Mode, Perplexity and Claude. Coverage matters more than depth at this stage.
- Google Search Console and Google Analytics admin rights. You need the generative AI performance reports and the ability to edit conversion windows.
- A CRM field for self-reported attribution. One free-text or picklist "how did you hear about us" field, captured on the form, not inferred later.
- An agreed cost figure. Whatever your team spends on GEO monthly, in a line your finance lead recognises. Track360 puts typical GEO spend at $2,000–$8,000 per month for schema audit and entity mapping, against $5,000–$50,000 per month for agency SEO (Track360).
If any of these are missing, fix them first. A pilot that starts without a baseline can only ever produce an anecdote.
Step 1: Record a repeated-measurement baseline, not a snapshot
Run your full prompt set across every target engine, then run it again. The probabilistic nature of AI search means answers vary across runs, prompts and time, which makes one-off observations unreliable — repeated measurement is required to characterise visibility as a distribution rather than a single-point outcome (Schulte et al., arXiv).
Concrete actions:
- Sample each prompt repeatedly over several weeks before you change anything, rather than treating one run as the answer.
- Log three things per response: did your brand appear, was it cited as a linked source, and which competitors appeared alongside you.
- Log the sources the engine cited instead of you. This becomes your remediation list.
What good looks like: a baseline table showing your appearance rate, citation rate and 3–5 competitors' rates per engine, with a visible range rather than a single number.
Common mistake: measuring once, celebrating a good result, then failing to reproduce it. If your boss can rerun the prompt and get a different answer, your credibility goes with it.
This is the step most teams skip because it feels like overhead. It is the step that makes every later number defensible. At Neverdrafts, we built position-weighted visibility scoring around this problem specifically — daily sampling of real ChatGPT, Claude, Google AI Mode and Perplexity answers, scored 0–100 based on where you appear in the answer, not just whether you appear. If you would rather compare tooling first, our engine coverage and price comparison covers the alternatives.
Step 2: Build the three-layer measurement framework
AI search ROI splits into three layers, each answering a different person in the room (HubSpot):
| Layer | Metric | Question it answers | When it moves |
|---|---|---|---|
| Visibility | Share of AI voice, citation rate | "Are we even showing up?" (CMO) | Weeks 1–4 |
| Engagement | AI-assisted traffic, branded query lift, direct traffic | "Is it bringing the right people?" (demand gen) | Weeks 4–8 |
| Revenue | Pipeline influenced, deals closed | "Is this moving the needle?" (CFO) | Months 3–6 |
The two formulas you need:
- Share of AI voice = prompts where your brand appears ÷ total prompts tracked × 100
- Citation rate = prompts where your brand is cited as a source ÷ total prompts × 100
Run the same calculation for 3–5 named competitors. Relative share is far more persuasive than absolute share, because it turns "we appear in 31% of answers" into "we appear in 31%, the category leader in 54%, and here is the gap."
Common mistake: presenting only layer one because it is the only layer with clean data. Without engagement context, leadership dismisses visibility as a vanity metric (HubSpot).
Step 3: Instrument your analytics so AI traffic is actually visible
Search Console's generative AI performance reports are rolling out to a subset of sites, so check availability before you promise this data to anyone (Google). Where available, they cover impressions, pages, countries, devices and dates for content appearing in AI Overviews and AI Mode, with hourly through monthly granularity.
Google Analytics added a Source Group dimension that consolidates messy source values and includes built-in grouping for emerging traffic sources like ChatGPT (OpenAI) and Perplexity, populated retroactively so you can analyse historical data (Google Help).
Then extend your attribution window. Google Analytics now supports custom integer lookback windows — 1 to 30 days for engaged-view conversions and 1 to 90 days for click-through conversions (Google Help). A default short window systematically undercounts AI influence, because the typical journey runs: buyer asks AI, sees your brand, searches your name days later, converts through a branded ad — and last-click credits paid search, giving AI zero (HubSpot).
What good looks like: a weekly view of branded query volume in Search Console and direct traffic trends in Analytics, both isolated and charted against your visibility timeline.
Step 4: Set the timeline expectation before you set the target
Present the delayed funnel as a feature of the measurement plan, not an excuse delivered in month four. Tell your boss in the kick-off meeting exactly what will move and when:
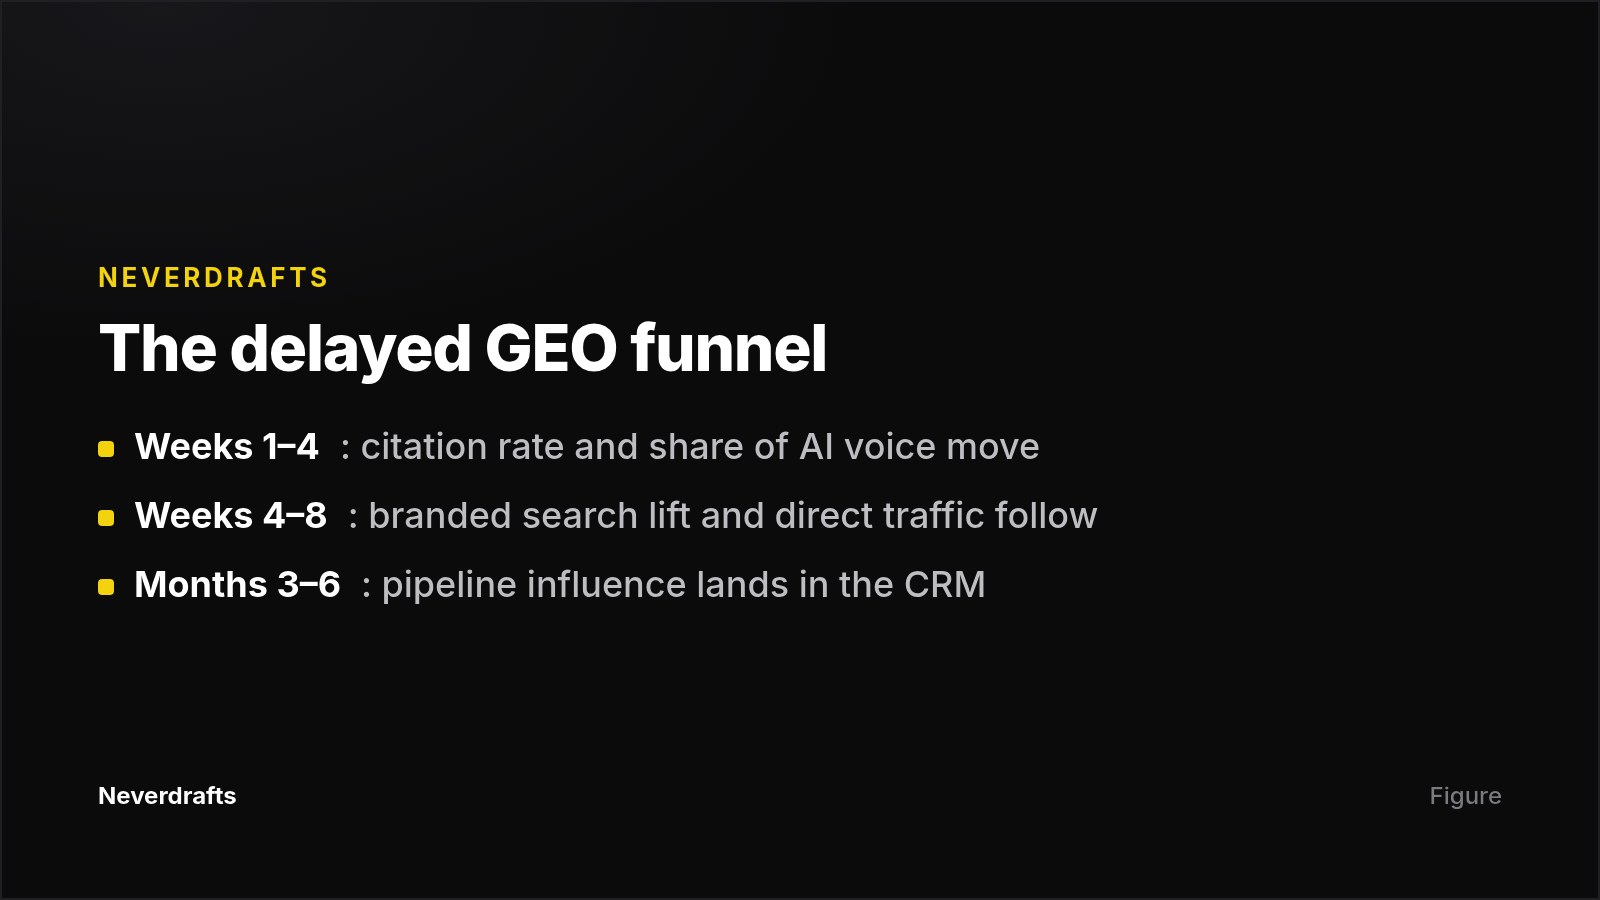
- Weeks 1–4: citation and share-of-AI-voice movement in your tracked prompt set.
- Weeks 4–8: branded search lift and direct traffic increases as AI-influenced users recall your name and search for it directly.
- Months 3–6: pipeline influence appears in the CRM.
Track360's own comparison puts GEO time-to-impact at 30–90 days once schema and entity mapping ship, against 3–6 months for traditional SEO (Track360). Use that as the working assumption and revise it with your own data.
Common mistake: committing to a revenue number in month one. Early visibility metrics give you credible data before any deal closes, which is precisely why you report them — so you are not walking into a leadership meeting empty-handed while revenue matures (HubSpot).
Step 5: Build the money model and report it every month
The arithmetic is deliberately simple: (revenue attributed − cost) ÷ cost. The judgement sits in what you attribute.
Concrete actions:
- Tag every AI-sourced session you can capture with a UTM parameter or the Source Group dimension.
- Add the self-reported CRM field as a second signal, because it catches journeys analytics never sees.
- Model a third bucket yourself: branded search lift above your pre-pilot trend line. This is a modelled estimate, not a measured one — label it as such on the slide, every time.
- Present all three buckets separately. Never blend a modelled number into a measured one without flagging it.
Then rerun the report monthly, in the same one-page format:
- Top line: share of AI voice this month vs. baseline vs. top competitor.
- Middle: branded query volume and direct traffic, week over week, overlaid with the visibility change.
- Bottom: influenced pipeline and closed deals with self-reported AI attribution.
- Footer: spend, and the ROI calculation with assumptions listed.
What good looks like: a single slide with a conservative case, a measured case and the stated undercount you cannot quantify. Finance leaders trust ranges with visible assumptions far more than a precise number with hidden ones.
Common mistake: claiming full revenue credit for a touchpoint that was one of several. Say "influenced pipeline," show the multi-touch path, and let the size of the number do the arguing. Consistency matters too — a number that appears in the same place every month becomes a metric the business manages; a number that appears once becomes a slide nobody remembers.
For agency-side readers packaging this for clients, we cover the retainer mechanics in how to build AI visibility monitoring into an SEO retainer.
Step 6: Frame the cost of doing nothing
ROI arguments land harder when the counterfactual is on the slide. The directional data available:
- U.S. organic search traffic fell 2.5% year over year in January 2026, while AI referral traffic to retail sites surged 693% over the same period (HubSpot).
- 50% of consumers now use AI search, putting 20–50% of traditional search traffic at risk (Bayleaf Digital).
- The average site's search traffic has dropped about 21% while its AI traffic has grown roughly ten times (Bayleaf Digital).
- Prompt volume grew by nearly 70% during the first half of 2025, and 58% of buyers now rely on AI recommendations (Bayleaf Digital).
Pair these with your own organic traffic trend for the same period. If your curve looks like the market curve, the budget question changes from "why spend on GEO" to "what happens if we don't."
Mistakes to avoid
- Reporting citations as revenue. HubSpot's framing is apt: a citation with no follow-through is a billboard a thousand people saw and nobody acted on (HubSpot).
- Tracking thousands of generic prompts. Coverage breadth looks impressive and proves nothing. A tight set of high-intent prompts produces a signal you can act on.
- Treating one measurement as truth. See Step 1. This is the single most common analytical error in GEO reporting (Schulte et al., arXiv).
- Promising a benchmark that doesn't exist. No published source currently provides independent citation-rate benchmarks by industry. Set targets against your own baseline and say so.
- Ignoring the referral undercount. AI engines rarely share referral data, so your measured AI traffic is a floor, not a total. State that explicitly rather than letting someone else discover it.
- Running GEO in isolation. Operators are advised to pursue traditional SEO, GEO and answer engine optimisation simultaneously — a page ranking eighth on Google with zero AI citations captures nothing from generative search (Track360).
Next step
Start the baseline this week, because every week without one is a week of proof you cannot recover. If you want the measurement running without building it yourself, Neverdrafts tracks real ChatGPT, Claude, Google AI Mode and Perplexity answers daily for your prompt set, scores each result 0–100 by position, and records before/after citation changes so the lift is documented rather than asserted. Plans start at $99 per month for 50 tracked prompts, and there is a $1 three-day full-access trial if you want a baseline on the table before the budget meeting.
Frequently asked questions
How long before I can show my boss any GEO result?
Visibility metrics move first, typically within weeks 1–4, followed by branded search and direct traffic in weeks 4–8 and pipeline influence in months 3–6 (HubSpot). Agree this sequence up front so early reporting reads as progress, not as a substitute for revenue.
What is a good citation rate to aim for?
No independent industry benchmark by sector currently exists, so target improvement against your own baseline. For scale: Track360's own blog reports moving Claude citation rate from a 60% baseline to 78% across 500+ posts in 90 days, a vendor-reported case rather than an independently audited one (Track360).
Can I track AI referral traffic in Google Analytics?
Partially. The Source Group dimension includes built-in grouping for ChatGPT (OpenAI) and Perplexity and populates retroactively (Google Help). But AI engines rarely share full referral data, so treat measured AI traffic as a floor and supplement it with branded search lift and a self-reported CRM field.
Should I extend my conversion attribution window for GEO?
Yes. AI-influenced buyers frequently see a mention, then return days later through branded search or direct traffic. Google Analytics now supports custom lookback windows of 1–30 days for engaged-view conversions and 1–90 days for click-through conversions (Google Help), which lets you align the window to your real sales cycle instead of a default.
How many prompts should a GEO pilot track?
Twenty to forty high-intent prompts is a workable scope for a first pilot. The constraint that matters is repeat sampling, not breadth — because AI answers vary across runs and over time, you need multiple measurements per prompt to produce a reliable distribution (Schulte et al., arXiv).
What if my boss says AI traffic is too small to matter?
Show the trend, not the absolute. U.S. organic search traffic fell 2.5% year over year in January 2026 while AI referral traffic to retail sites rose 693% (HubSpot), and 50% of consumers now use AI search, putting 20–50% of traditional search traffic at risk (Bayleaf Digital). Overlay your own organic curve on those.
Sources
- Introducing Search Generative AI performance reports in Search Console — Google Search Central Blog
- AI search visibility ROI: How to measure what matters (& ignore what doesn't) — HubSpot Blog
- Don't Measure Once: Measuring Visibility in AI Search (GEO) — Schulte, Bleeker & Kaufmann, arXiv
- What's new in Google Analytics — Google Help
- Generative Engine Optimization Trends 2026 — Bayleaf Digital
- Generative Engine Optimization: The 2026 SEO Evolution — Track360